Urban Heat Island, Extreme Heat, Climate Adaptation
Fried museums: Analysing the interactions between extreme heat, The City of Liverpool and its museums
Abstract
What I investigated
The work is structured around four interlocking strands, each with its own dataset and method, and all converging on the same institution:
- Spatial UHI mapping using Landsat 8 thermal imagery (30 m resolution) and MODIS LST (1 km, daily) across the summers of 2018–2022, to locate hotspots and quantify each museum’s heat exposure.
- Physical risk assessment of NML’s collections, built on a structured survey with NML’s Head of Collections Care covering hygroscopic material composition, climate-control infrastructure, and observed climate-related damage.
- Visitor dynamics during four documented Liverpool heatwaves (2018, 2019, 2021, 2022), correlating daily visitor counts at each site against maximum and mean daily temperatures from the Shawbury station.
- Energy consumption across all NML sites for 2018–2022, tested against monthly Tmax to quantify the temperature-driven component of the museums’ operational footprint.
The unifying question across all four strands: does urban heat reshape what a museum is, what it costs to run, and who walks through its doors?
What I found
Finding 1: NML’s two flagship inland sites sit directly inside the city’s UHI hotspot
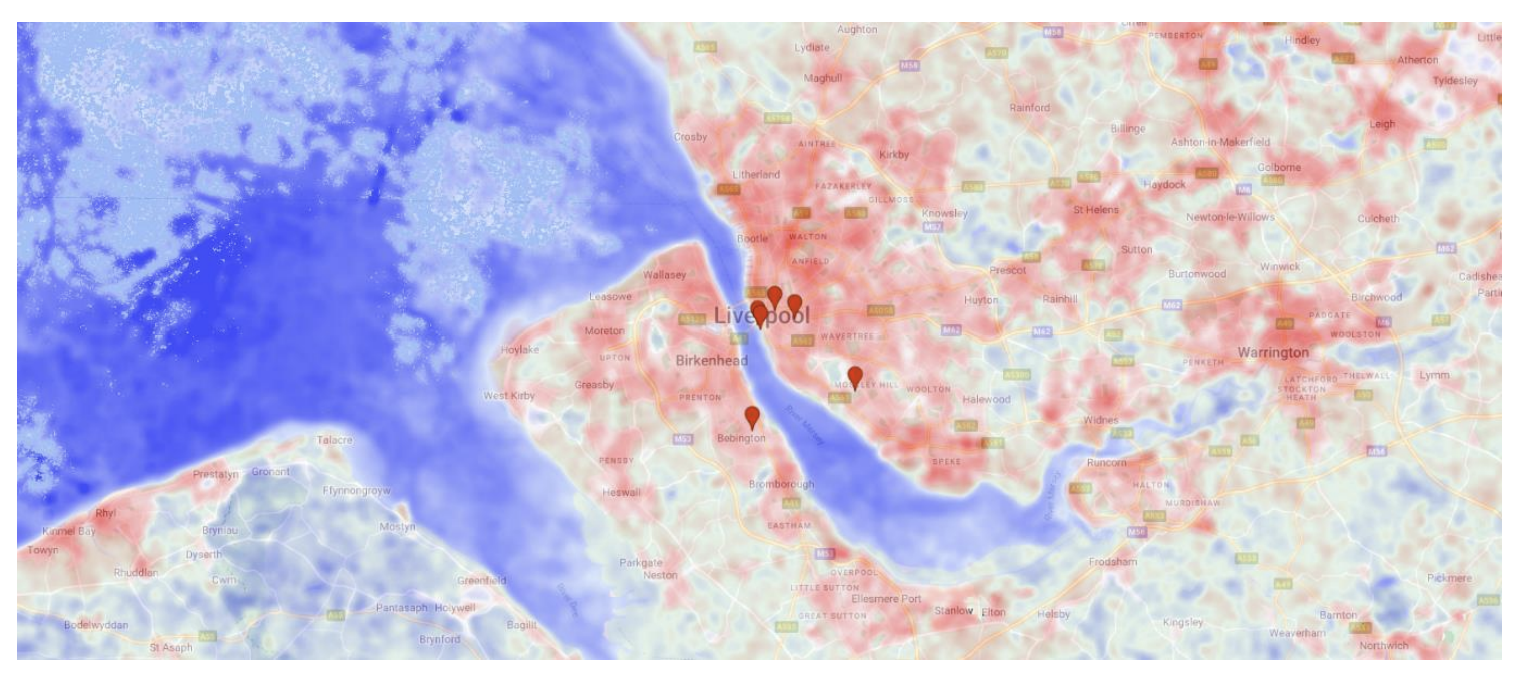
Combining Landsat-derived Land Surface Temperature (LST) and MODIS daytime UHI across summers 2018–2022, the Walker Art Gallery and the World Museum consistently occupy the hottest part of central Liverpool. The Walker records a mean LST of 32.07 °C and a UHI intensity of +1.38 — the highest of any NML site. The World Museum is close behind at 28.80 °C and +0.68. Both sit at zero metres from the nearest UHI hotspot.
The waterfront sites — the Museum of Liverpool, the International Slavery Museum, and the Merseyside Maritime Museum — present the opposite picture: LST values of 25.86–26.97 °C and slightly negative UHI intensities. The Mersey is doing the work that vegetation does in greener cities.
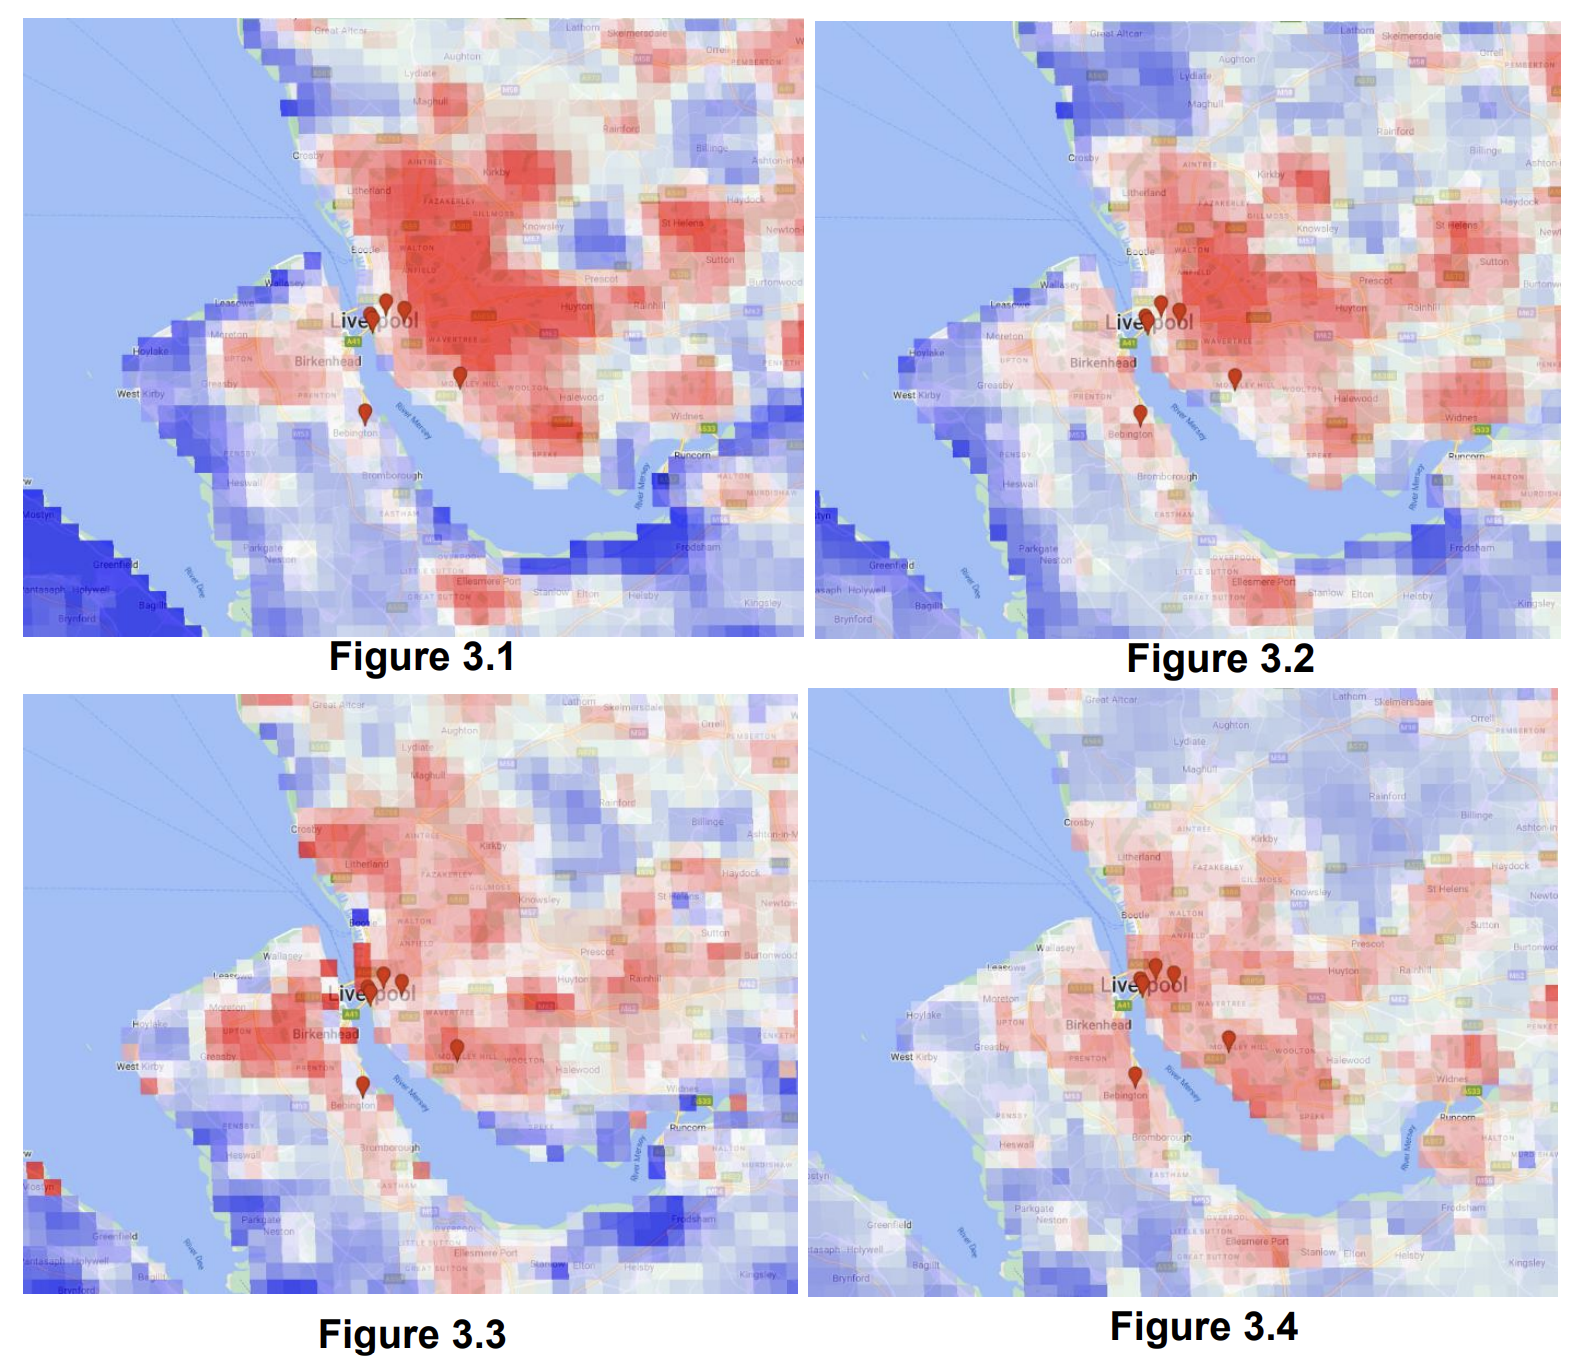
Finding 2: The UHI signal is strongly diurnal, and heatwaves intensify it asymmetrically
MODIS day–night decomposition shows that the high daytime UHI values at the Walker and World Museum (5.68 in normal conditions, climbing above 6.10 during heatwaves) collapse to near-zero at night. This diurnal swing is not a curiosity — it directly determines whether collections and buildings get a recovery window.
The asymmetry matters most during heatwaves. Daytime UHI rises sharply at the inland sites (+0.4 above baseline), while waterfront sites stay relatively buffered. Nighttime UHI rises far less. The picture is one of intense daytime heat loading at specific points in the city, partially relieved by nocturnal cooling — but with that relief becoming less effective as heatwaves persist.
The implication: cooling-system stress at the Walker and World Museum is concentrated in a narrow daytime window during heatwaves. This is precisely where HVAC margin is consumed fastest.
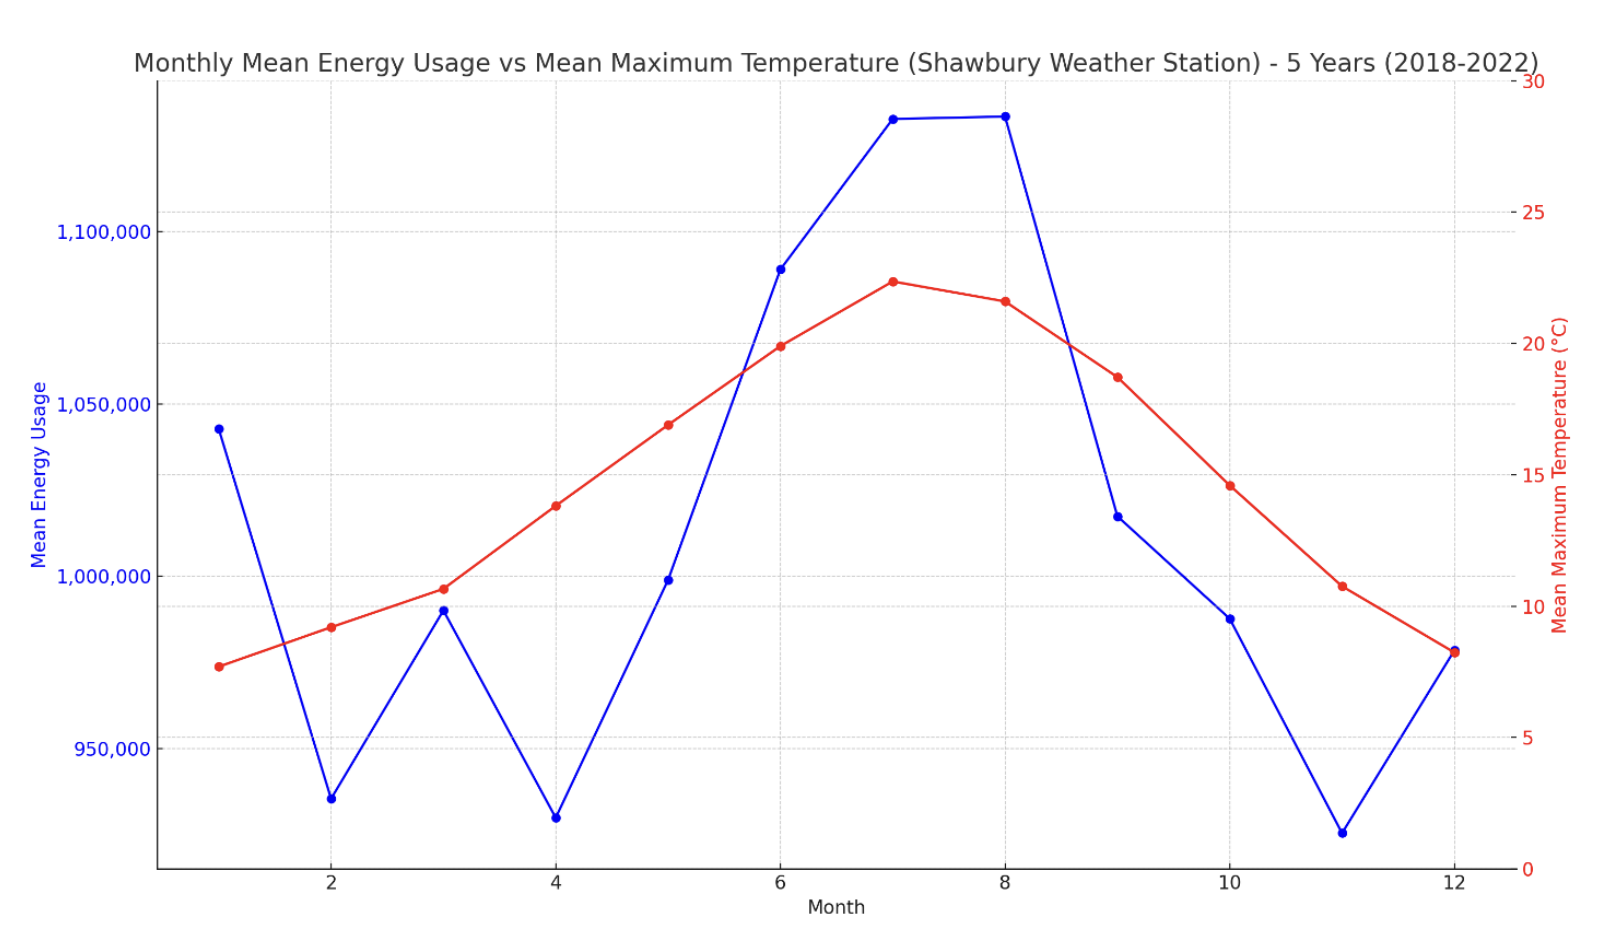
Finding 3: Energy consumption is strongly temperature-coupled — except in 2020
Aggregating NML’s monthly energy data for 2018–2022 against monthly Tmax from Shawbury produces a clean positive relationship: Pearson r = 0.73 across the full five-year window. Year-by-year, the coupling is even stronger in 2018 (r = 0.87) and consistently moderate-to-strong in 2019 (0.49), 2021 (0.59), and 2022 (0.55).
The exception is 2020, where the correlation collapses to r = −0.06. This is not a measurement error — it is the COVID-19 closure period overriding the temperature signal. With visitors absent and operations curtailed, the temperature-driven component of energy demand briefly disappeared from the record. The contrast is one of the cleaner natural experiments in the dataset: it isolates how much of NML’s summer energy expenditure is occupancy-and-operation-driven on top of the baseline thermal control of the buildings.
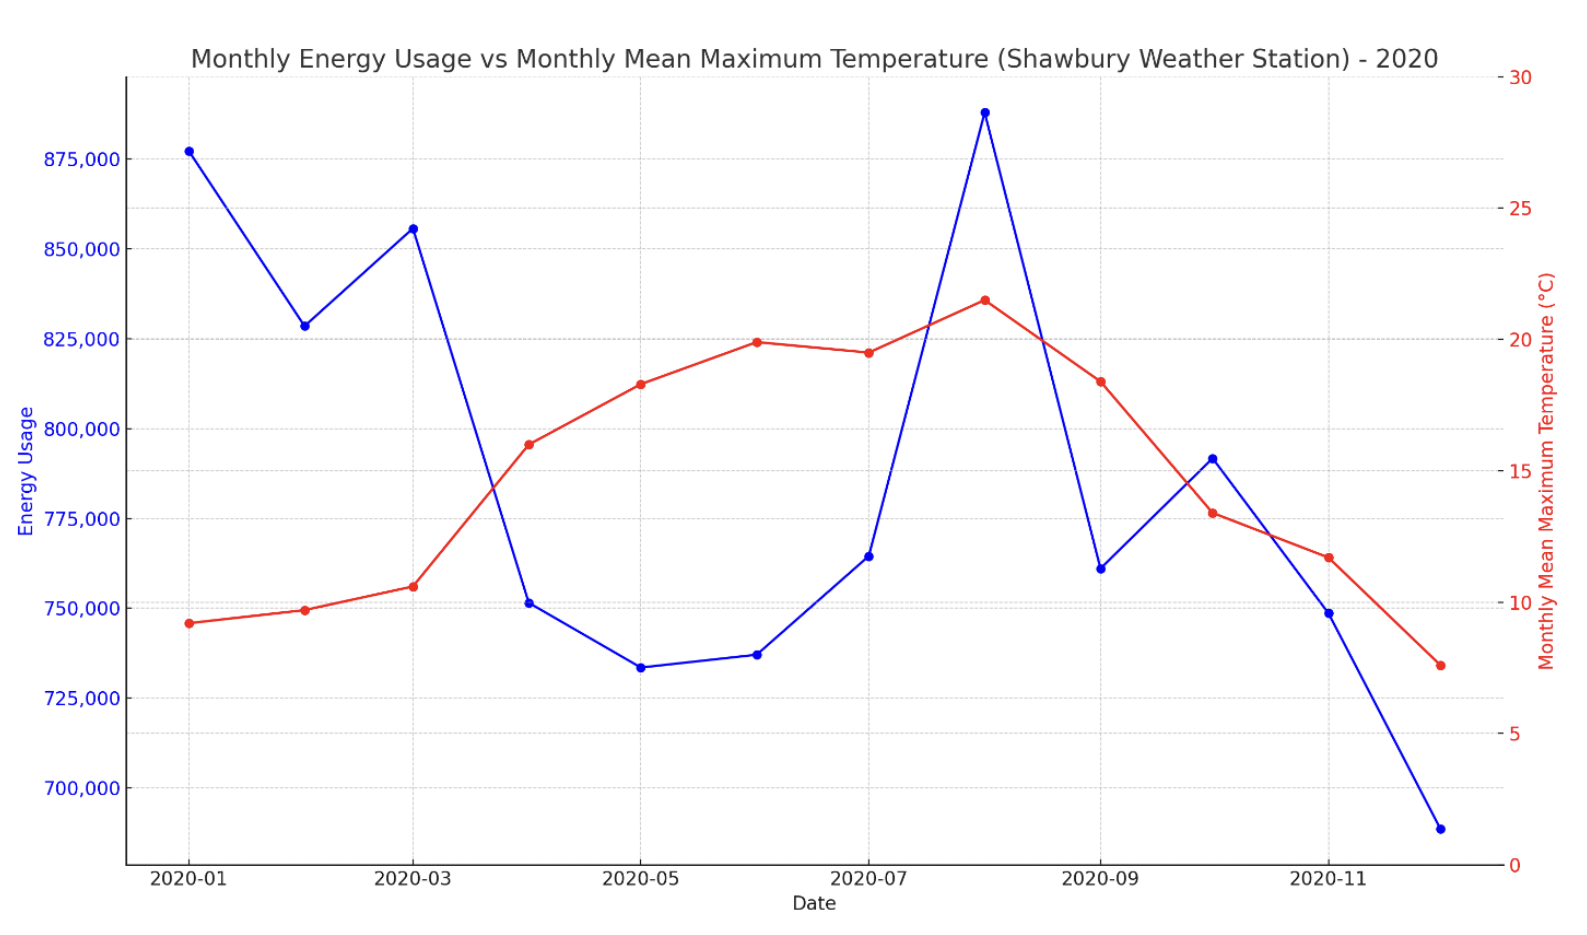
The implication: a meaningful share of NML’s heat-driven energy bill is conditional on the museums being open and occupied. This has real consequences for adaptation planning — it means demand-side measures (ventilation timing, opening hours, visitor flow management) have leverage that purely passive retrofits do not.
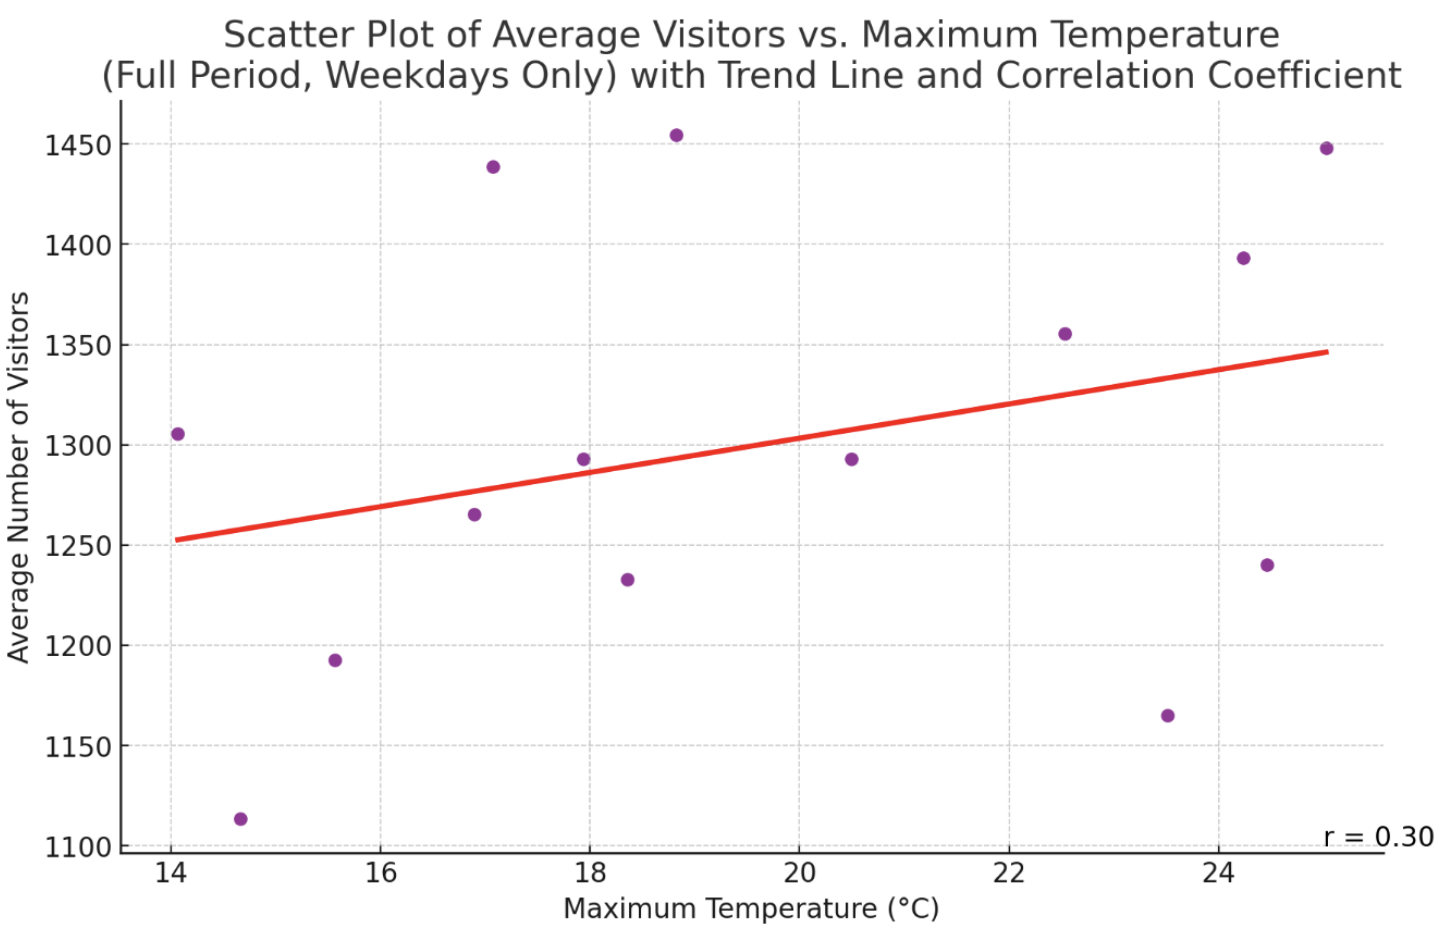
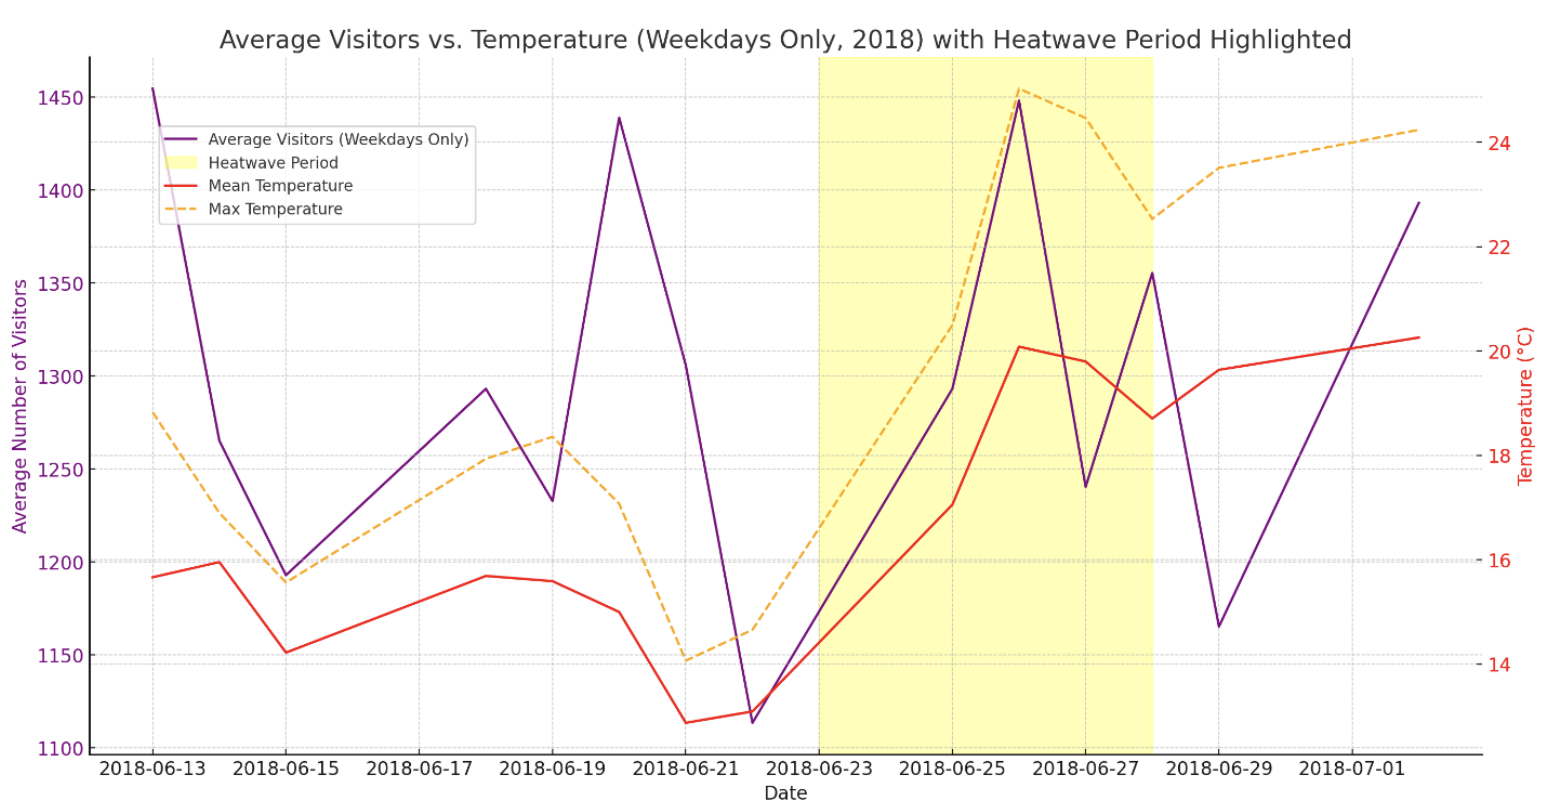
Finding 4: Visitor numbers respond weakly but positively to heat — consistent with a “cool space” effect
Across the 2018 and 2019 heatwaves, the correlation between maximum daily temperature and visitor numbers is positive at every site analysed, though never strong: r = +0.35 at the World Museum, +0.12 at Sudley House, +0.30 averaged across all sites. In 2019, Sudley House — a smaller, suburban venue — showed a stronger response than in 2018, suggesting that as heatwaves intensify, even peripheral sites begin to act as thermal refuges.
This is the inverse of the intuitive “people stay home in the heat” expectation, and it aligns with the literature on indoor cool-space behaviour during extreme weather. The signal is weak — temperature alone explains only a small fraction of visitor variance — but it is consistent in sign across years and sites. NML’s larger, climate-controlled, central venues attract slightly more visitors when it is hot outside, not fewer.
The implication: museums are already functioning as informal cooling refuges. They could be doing this deliberately, with public-health partners, rather than as a side-effect of having air conditioning.
Tentative conclusions
The four strands tell a single story. Liverpool’s UHI is real, spatially uneven, and concentrated precisely on two of NML’s most visited and most collection-dense sites. The thermal pressure on those buildings translates directly into measurable energy expenditure (r = 0.73), into elevated risk for the high-vulnerability collections at the Walker Art Gallery and International Slavery Museum (where 76–100% of materials are hygroscopic), and, paradoxically - into a small positive pull on visitor numbers, as the climate-controlled interior becomes more attractive than the street outside.
The 2020 anomaly is the most diagnostically valuable result in the dataset. It shows that the temperature-energy coupling is not a fixed building property; it depends on the museum being a working museum. This means adaptation strategies have more degrees of freedom than a pure HVAC-upgrade framing would suggest.
If the picture holds, the operational implication for NML and for similar urban museum networks is concrete: treat UHI exposure as a site-specific risk factor, not a city-wide one; pair collection-care planning with explicit thermal-vulnerability mapping; and start formalising the “cool space” role that the larger sites are already playing during heatwaves.
Limitations and future work
The dissertation is an MSc-scale study and the boundaries of what it can claim are real:
Surface vs. air temperature. Landsat and MODIS measure LST, not the air temperature that visitors and HVAC systems respond to. The two are correlated but not identical, and the gap matters most at exactly the times - afternoon peaks - that the analysis focuses on. A follow-up using in-building or near-building air-temperature sensors would tighten this considerably.
Temporal resolution of the energy data. Monthly energy totals smooth over the daily and hourly demand spikes that drive HVAC stress. Sub-daily metering would let me identify the specific weather conditions that produce peak load, rather than just the seasonal envelope.
The visitor analysis is correlational, not causal. Daily visitor counts cannot distinguish “I came because it was hot” from “I came despite the heat for the exhibition opening.” Hourly entry data, or a survey of visitors during a heatwave, would let me actually test the cool-space hypothesis instead of inferring it from a weak positive correlation.
Humidity is missing throughout. RH is at least as damaging to hygroscopic collections as temperature, and as influential on visitor comfort. The risk assessment touches it through the survey, but the spatial and temporal analysis does not. This is the single largest gap in the study.
One respondent. The risk-assessment survey draws on a single, expert respondent - Dr. Baars - who provided invaluable depth but whose estimates are professional judgment rather than database queries. Expanding to per-site curators, and ideally to direct collection condition assessments, would replace approximation with measurement.
A more rigorous follow-up would extend the spatial UHI analysis with air-temperature sensors deployed at each site, integrate sub-daily energy and HVAC data, add humidity throughout, and test the cool-space hypothesis with a deliberate visitor survey during a heatwave. The 2020 anomaly should also be deepened: it is the cleanest natural experiment in the dataset and deserves its own focused write-up.
Sources and acknowledgements
Particular thanks to Professor Rob Wilby (Loughborough University) for supervising the work, and to Dr. Christian Baars (Head of Collections Care, NML) for opening the museums’ data and for the candour of his survey responses.
The full reference list is in the dissertation PDF.